Finally know what your recruiting actually costs – and delivers
Paul delivers the real numbers your leadership wants – cost-per-hire by channel, funnel conversion, rejection reasons. In real time, without your team maintaining a single cell.

Trusted by leading companies and enterprises


The Problem
Your recruiting reports are only as good as their data – which rarely gets maintained
Updating stages, tagging sources, logging rejection reasons – these tasks always end up at the bottom of the recruiting to-do list. Understandable. The result: dashboards full of gaps, decisions made on gut feeling.

7 %
93% have gaps in their data – even though the tools are already there.

12 %
What reaches leadership is often Excel-pivot, not reliable reporting.

9 %
Ad spend, external fees, internal hours – the true cost-per-hire stays a guess.

Questions you could never reliably answer. Until now.

Which channels deliver hires – and which just deliver clicks?
Volume isn't success. Without conversion data per source, your budget is a bet.
What does a hire actually cost you?
Ad spend plus external fees plus internal hours – the real number per hire. And per source.
Where in your funnel do you lose the most candidates?
Between application and interview? At screening? Before the offer? No funnel data, no answer.
Why do strong candidates turn down offers?
Location, availability, compensation, qualifications – the real patterns only show up in aggregate.
Are your channels reaching the audience you actually need?
TikTok delivers Gen Z talent. Job boards deliver experienced professionals. You should know which is which.
What do candidates ask that your postings don't answer?
If half the chats are about scheduling, that should be in the posting.

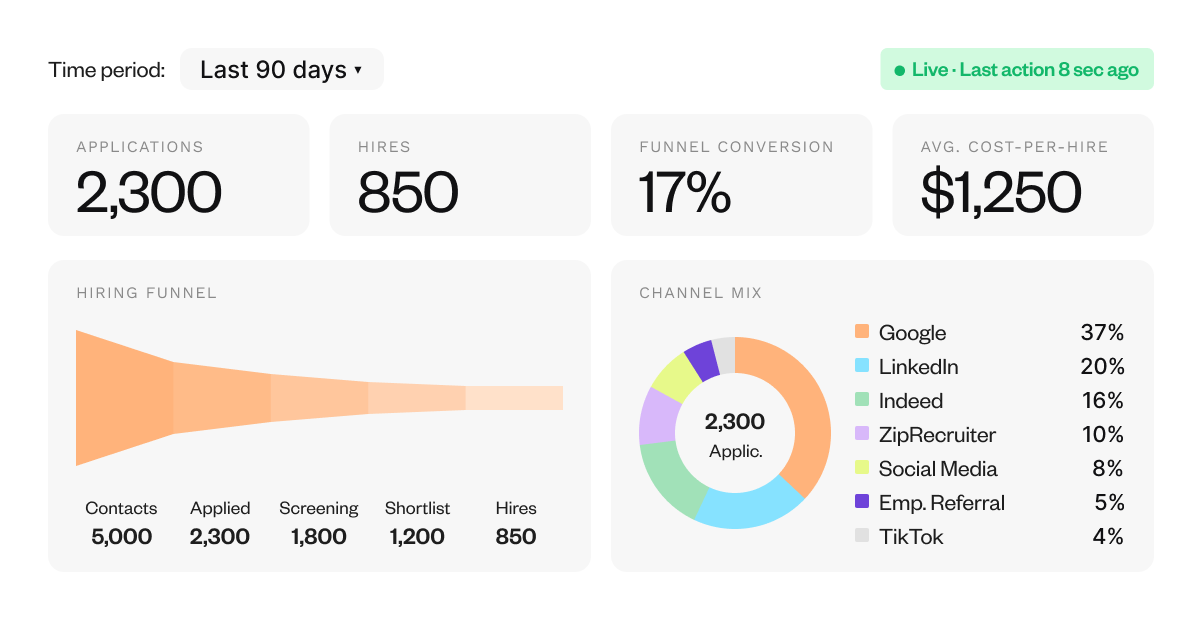
Here's what it looks like in your dashboard
Examples from real customer data – every view runs live and automatically.

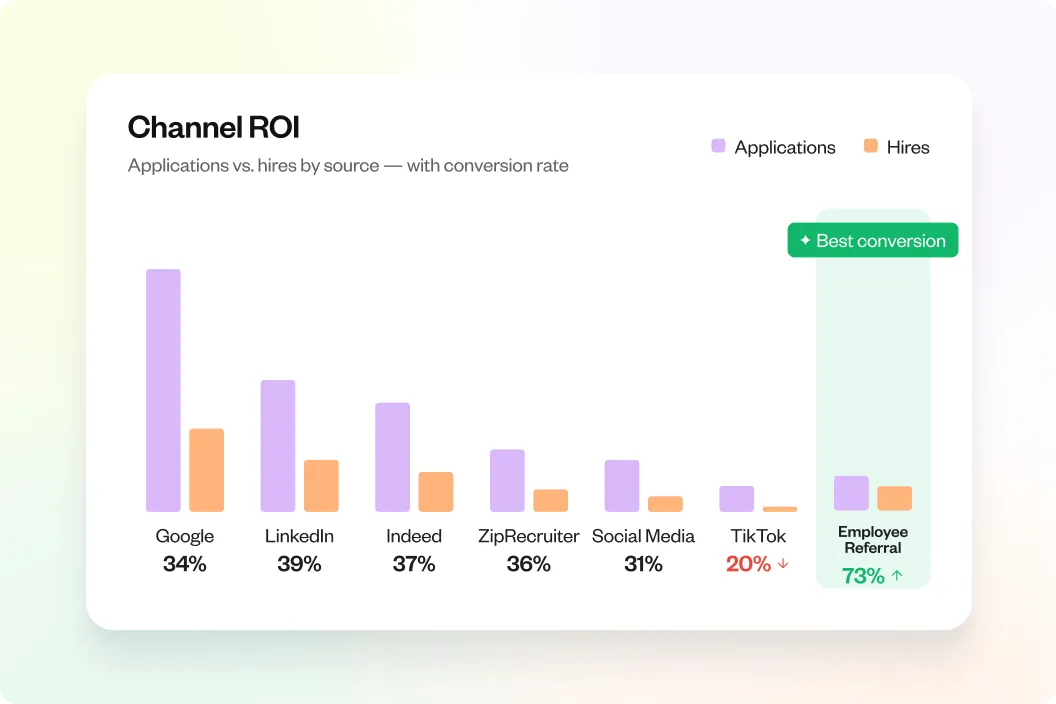
Which sources pay off –
and which burn budget?
Interview
Paul posts to every channel and knows exactly where each contact came from. Per source: applications, conversion rate, success rate. At a glance: which dollar of recruiting spend pays off – and which doesn't.

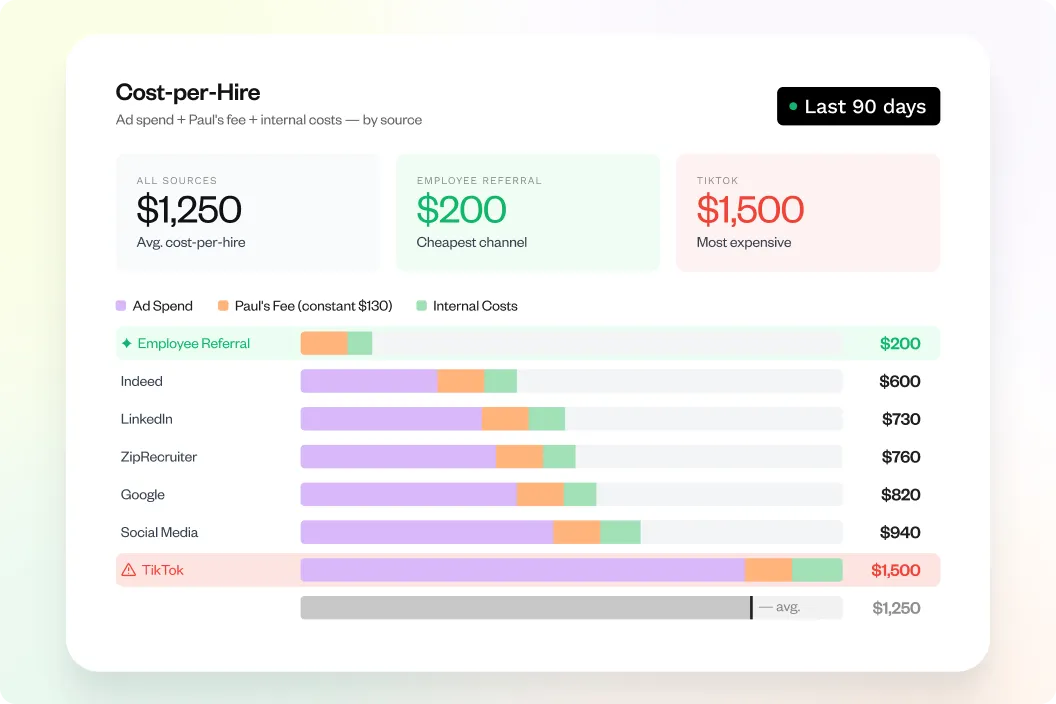
What does a hire cost –
and what costs an empty seat per day?
Interview
Paul connects every cost component: ad spend per channel, his per-hire fee, and optionally internal costs like recruiter hours. Result: a true cost-per-hire by source. Cost of vacancy also available.

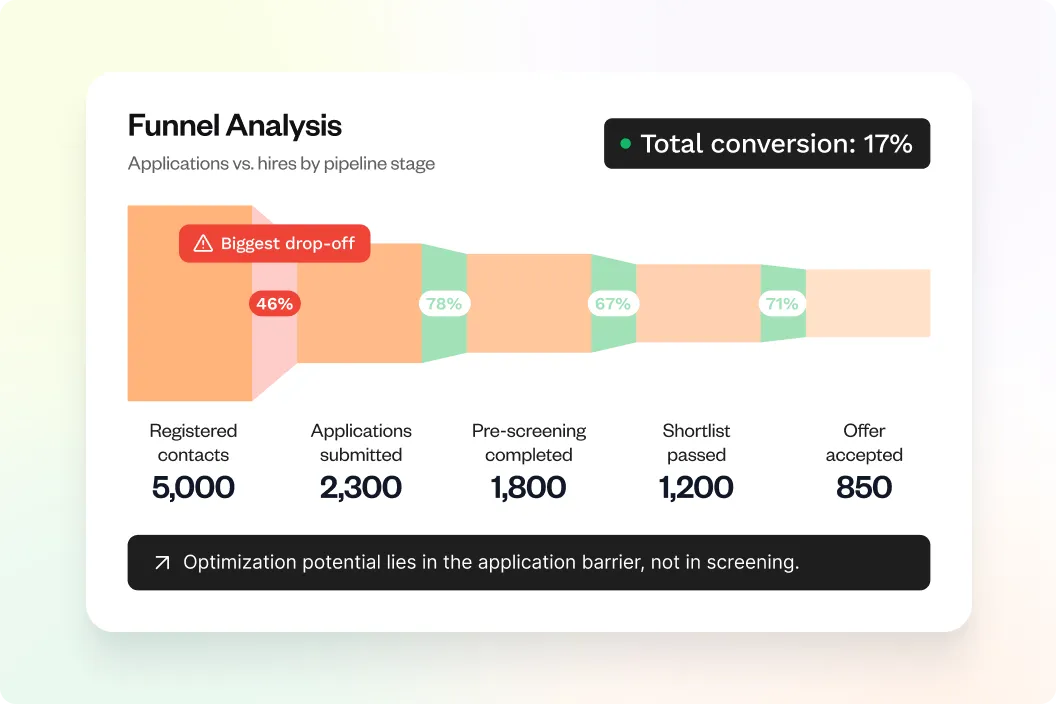
Where in your pipeline are most candidates dropping off?
Interview
From registered contact through application, pre-screening, to offer accepted — including conversion rates at each stage. Drop-offs become visible before they hurt.

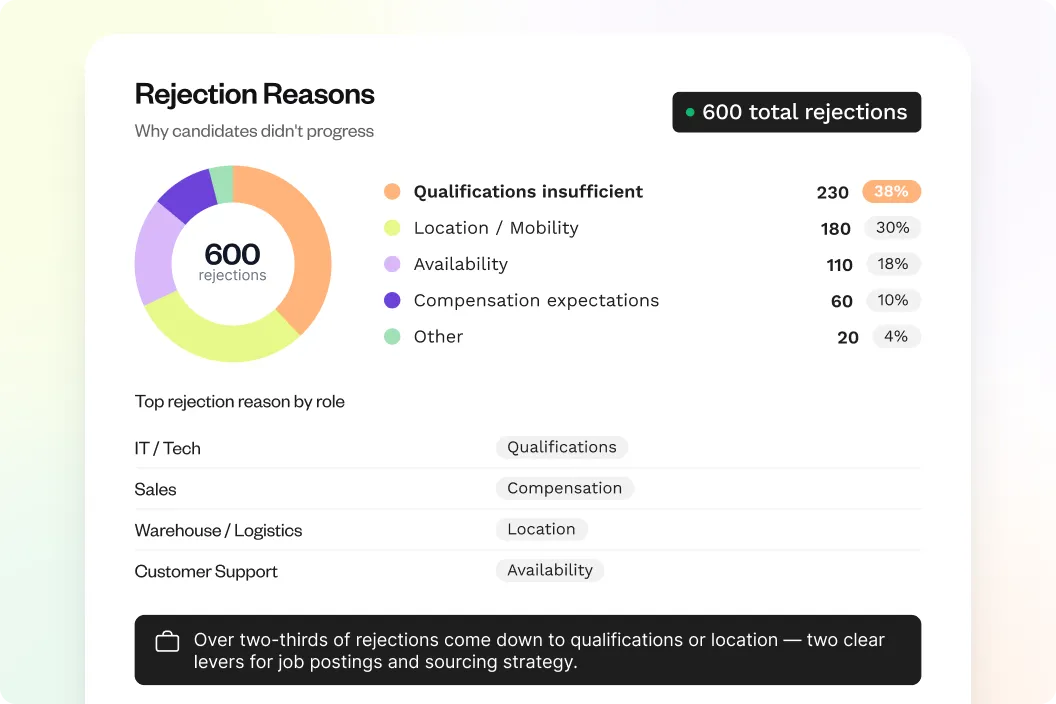
Why didn't candidates fit - really?
Interview
Paul talks to every applicant and therefore knows the exact reason. Broken down by role, function, and location — the data foundation for job postings, sourcing strategy, and recruiting marketing.

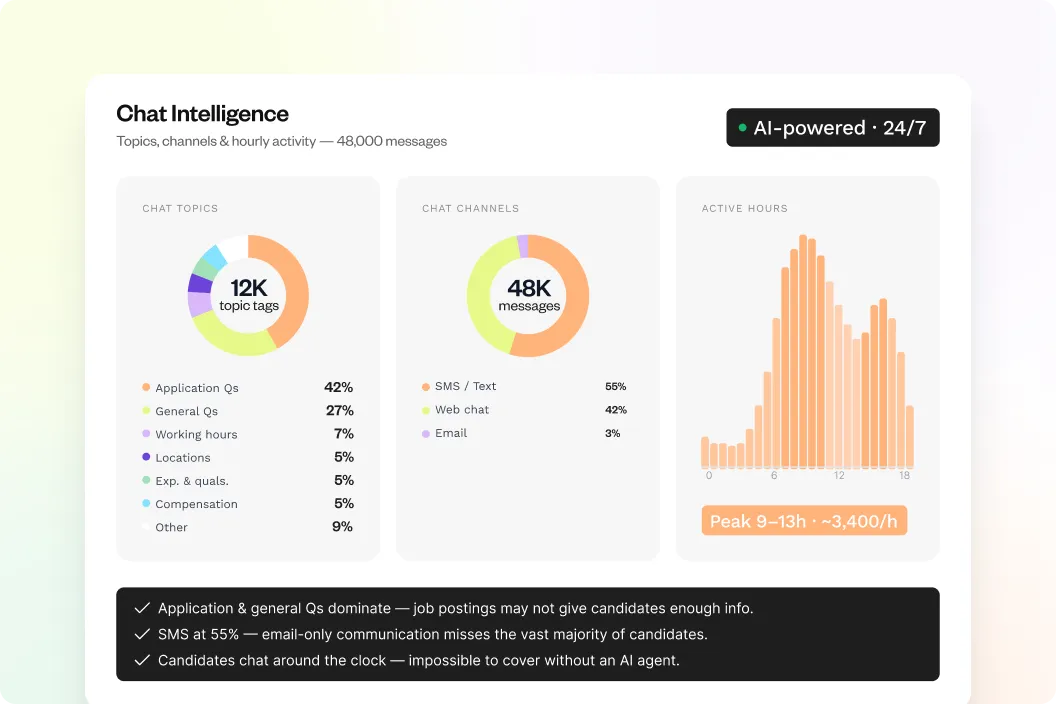
What candidates talk about –
and when.
Interview
Paul analyzes the conversations themselves — top topics, preferred channels, activity by hour. Every chat becomes a data point for your job postings, careers page, and communications strategy.

Want to see your numbers like this?
In a 30-minute demo, we'll show you which of these views Paul would build for your team.


Why classic recruiting reports fail at three points
Not for lack of tools. For lack of data.

Because no one wants to maintain data.
Updating stages, tagging sources, and logging reasons – it gets pushed back day after day. A dashboard full of gaps is no basis for decisions.
Because data sits in silos.
ATS, HRIS, Excel, job-board backends. Every report tells a different story. Hours go into reconciling them.
Because reports are outdated the moment they're done.
Monthly Excel exports. By the time leadership sees the numbers, the situation has already changed.

What Paul actually tracks
Measured against active customer processes – not extrapolated, not estimated.


0
Updating days, taggingsources, loggingreasons — it gets pushed back day after day. A dashboard full of gaps is no basis for decisions.

30+
Updating days, taggingsources, loggingreasons — it gets pushed back day after day. A dashboard full of gaps is no basis for decisions.

Live
Updating days, taggingsources, loggingreasons — it gets pushed back day after day. A dashboard full of gaps is no basis for decisions.

1 click
Updating days, taggingsources, loggingreasons — it gets pushed back day after day. A dashboard full of gaps is no basis for decisions.
Curious how this would look for your roles?

Our customers love Paul
What changes when recruiting runs autonomously – faster and more efficient.


Your data. In one dashboard. Under your control.
Paul's Dashboard
One central dashboard for all analytics. Real-time, filterable by location, time period, or role – exportable as PDF or CSV anytime. For board meetings, audits, or your own reporting.
GDPR-compliant
Full data sovereignty, secure infrastructure, data processing agreements included by default.
Full transparency
Every data point traceable. Drill-down from the top KPI to the individual candidate touchpoint.
.avif)
FAQs
Classic ATS analytics are only as good as the manually maintained data behind them – stages, source tags, rejection reasons. In practice, much of it gets skipped. Paul runs the recruiting process itself and documents every step automatically. The data emerges directly from the process – without extra effort.
Time-to-decision, pre-screening duration, channel performance, cost-per-hire, conversion rates by funnel stage, rejection reasons, demographics, chat topics, candidate engagement, role-level statistics, and more – over 30 KPIs, depending on configuration.
Yes. Paul knows ad spend per channel (he posts the jobs himself) and his own per-hire fee. If you also enter internal costs once – e.g. recruiter or manager hours – you get a complete cost-per-hire by source. Cost of vacancy (the daily cost of an unfilled role) can also be calculated as soon as daily salary or revenue figures are added per role.
No. Paul comes with a fully featured dashboard out of the box. Filters, drill-downs, and exports as PDF or CSV are built in – sufficient for most companies.
See your recruiting in numbers. Live.
In a demo, we'll show you which KPIs Paul will track for your company automatically – and what your leadership dashboard would look like.